

Financial Projections
Executive Snapshot
NaturEdge Organics is a distribution-led organic FMCG and wellness business seeking ₹25 Lakhs in growth capital to scale a proven, repeatable revenue model. The five-year base-case projection targets revenue growth from ₹75 Lakhs in Year 1 to ₹6 Crores in Year 5, supported by progressive distributor expansion, retail and wholesale reach, and direct/digital sales.
Proposed Investment: ₹25 Lakhs
Projected Revenue (Year 1 → Year 5): ₹75 Lakhs → ₹6 Crores
Revenue CAGR (Y1–Y5): 68.2%
Cumulative 5-Year Revenue: ₹15.25 Crores
Year 5 EBITDA Margin: 25.5%
Business Model
The model is built around a distribution-led FMCG expansion strategy — not on sales appearing by assumption.
Distributor Network
National and regional distributors form the primary volume engine, built progressively rather than acquired all at once.
Wholesalers
Wholesale penetration extends product availability well beyond direct distributor territories.
Retail Network
Products move from selected stores into general trade, supermarkets, organic stores and specialty outlets.
Direct / Digital Sales
D2C, online and institutional sales add higher-margin, supplementary revenue on top of the core channels.
Together, these four channels convert capital into: Products → Distribution → Market Reach → Repeat Orders → Revenue → Cash Flow
Financial Trajectory
Revenue Growth Roadmap
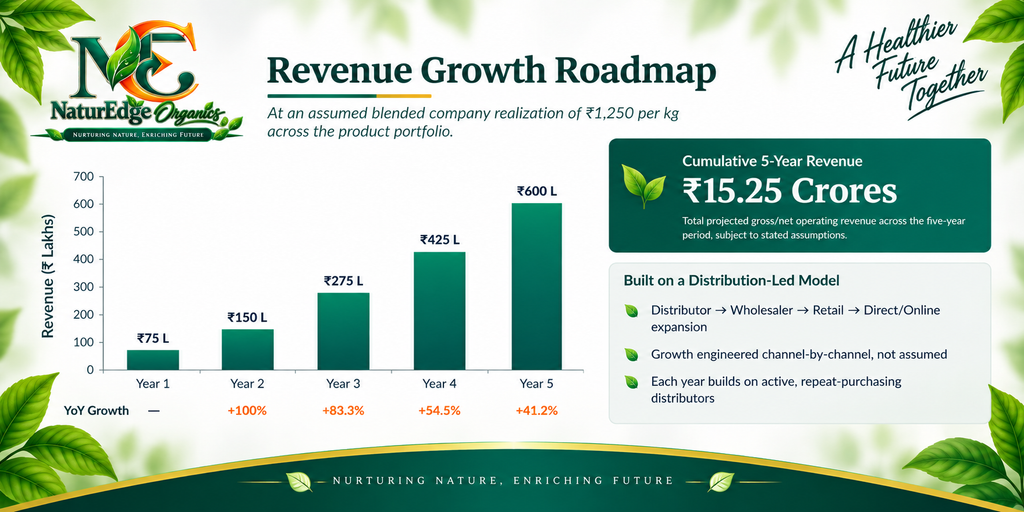
NaturEdge Organics projects progressive revenue growth from ₹75 Lakhs in Year 1 to ₹6 Crores in Year 5, supported by a distribution-led expansion model. Each year builds on active, repeat-purchasing distributors and expanding channel reach.
Year 1: ₹75 Lakhs
Year 2: ₹1.50 Crores
Year 3: ₹2.75 Crores
Year 4: ₹4.25 Crores
Year 5: ₹6.00 Crores
Cumulative 5-Year Revenue: ₹15.25 Crores
Distributor Expansion
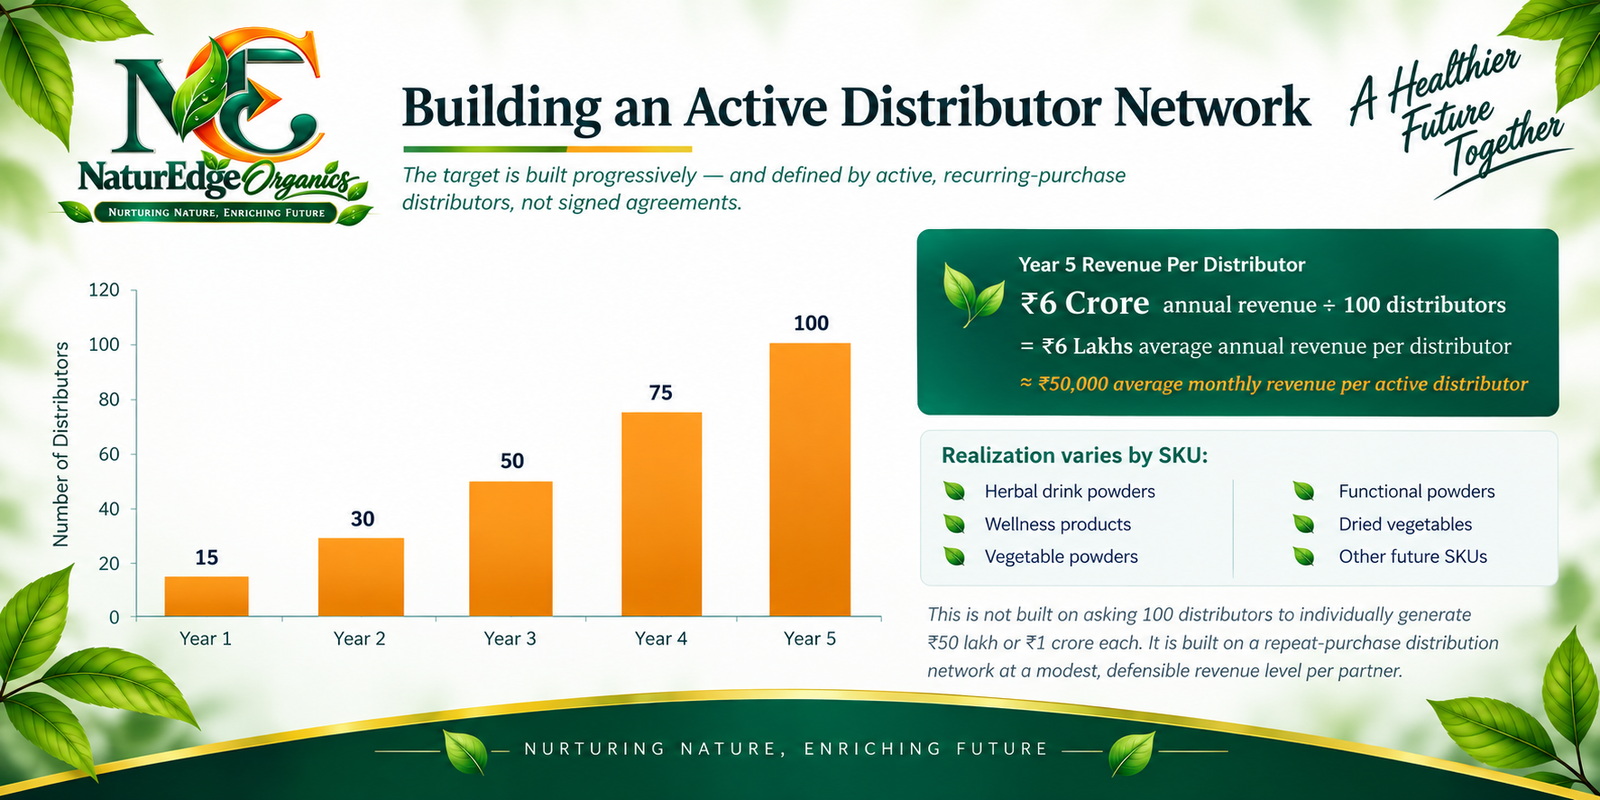
The growth model assumes a progressive increase in active distributors, with the network expanding from 15 active distributors in Year 1 to approximately 100 active distributors by Year 5. This creates a practical foundation for increasing geographic coverage and recurring sales.
Year 1: ~15 active distributors
Year 2: ~30 active distributors
Year 3: ~50 active distributors
Year 4: ~75 active distributors
Year 5: ~100 active distributors
Year 5 Distributor Economics
At full scale, the model targets approximately 100 active distributors, with average monthly revenue per distributor of approximately ₹50,000 and total monthly revenue of approximately ₹50 Lakhs.
Operational Scale
Sales Volume & Realization
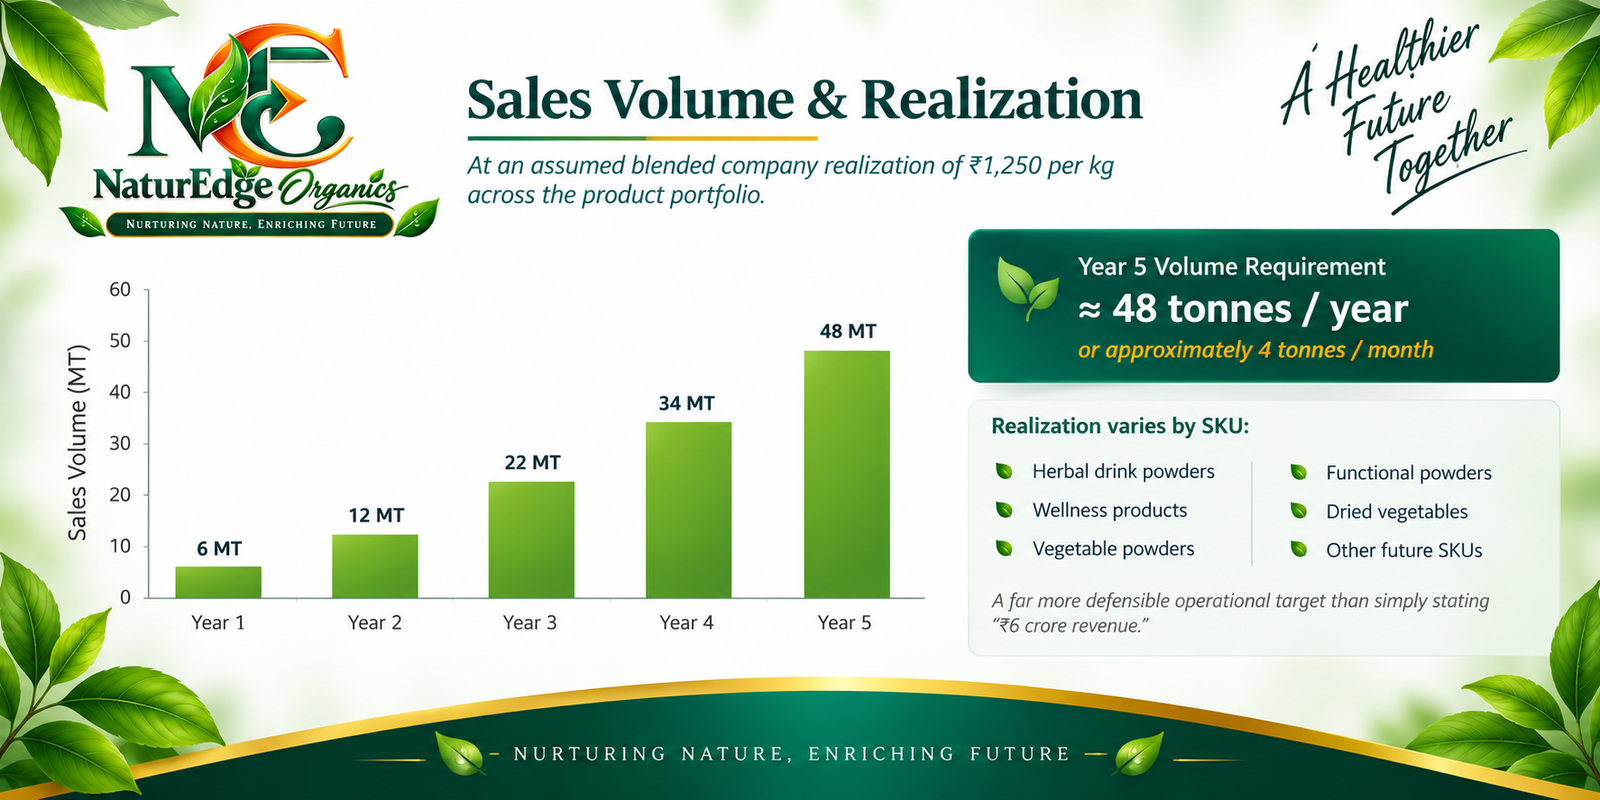
The projection assumes a blended company realization of ₹1,250 per kg across the product portfolio. The required annual sales volume increases progressively from 6 MT in Year 1 to approximately 48 MT in Year
Year 1: 6 MT
Year 2: 12 MT
Year 3: 22 MT
Year 4: 34 MT
Year 5: 48 MT
Year 5 Volume Requirement:
Approximately 48 tonnes per year, or approximately 4 tonnes per month.
Realization varies by SKU:
- Herbal drink powders
- Wellness products
- Vegetable powders
- Functional powders
- Dried vegetables
- Other future SKUs
Portfolio Strategy — A Diversified, Multi-SKU Revenue Mix
NaturEdge Organics is not dependent on a single SKU. The portfolio is designed to expand across multiple wellness and organic product categories while reusing the same distribution infrastructure. This allows the company to increase revenue per distributor and strengthen overall market presence.
Target Revenue Mix
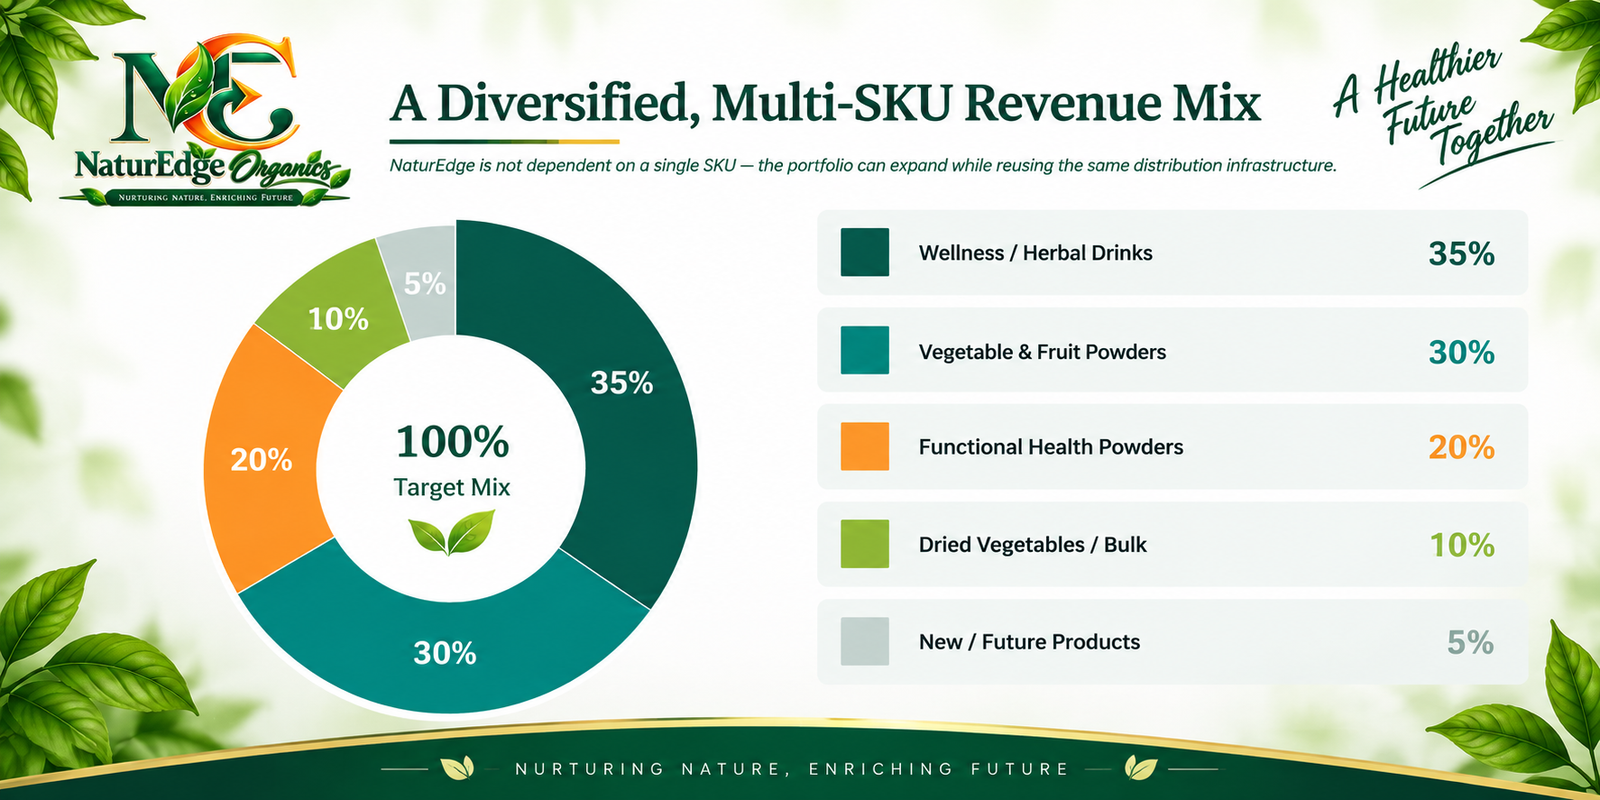
- Wellness / Herbal Drinks — 35%
- Vegetable & Fruit Powders — 30%
- Functional Health Powders — 20%
- Dried Vegetables / Bulk — 10%
- New / Future Products — 5%
Profitability — Gross Margin Expands With Scale
Gross margin is projected to improve progressively as the business scales, driven by procurement efficiencies, production improvements, packaging optimization, logistics efficiencies, and a stronger contribution from premium wellness products.
Projected Gross Margin
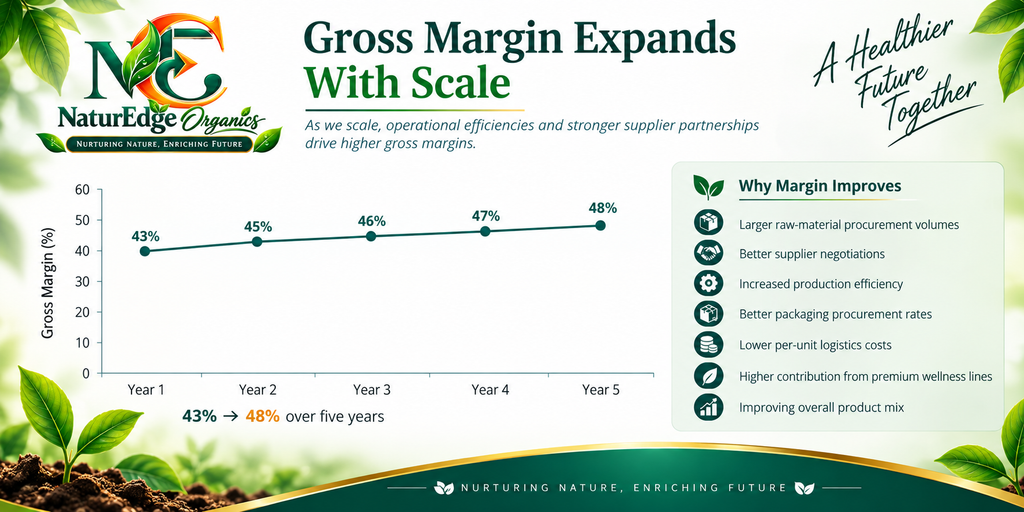
- Year 1 — 43%
- Year 2 — 45%
- Year 3 — 46%
- Year 4 — 47%
- Year 5 — 48%
- Why Margin Improves
- Larger raw-material procurement volumes
- Better supplier negotiations Increased production efficiency
- Better packaging procurement rates
- Lower per-unit logistics costs
- Higher contribution from premium wellness lines
- Improving overall product mix
Cost Structure — Operating Expense Grows With Revenue — By Design
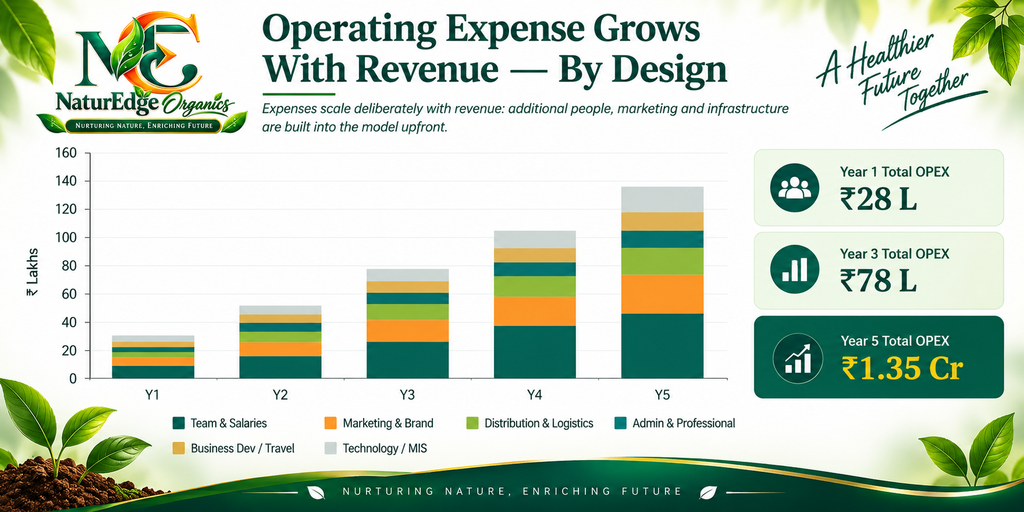
Operating expenses are designed to scale deliberately with revenue. Additional people, marketing, distribution infrastructure and business systems are built into the model upfront to support the projected expansion.
Operating Expense Categories
- Team & Salaries
- Marketing & Brand
- Distribution & Logistics
- Admin & Professional
- Business Development / Travel
- Technology / MIS
Projected Operating Expense
- Year 1 — ₹28 Lakhs
- Year 3 — ₹78 Lakhs
- Year 5 — ₹1.35 Crores
Operating Leverage — EBITDA Growth & Margin Expansion
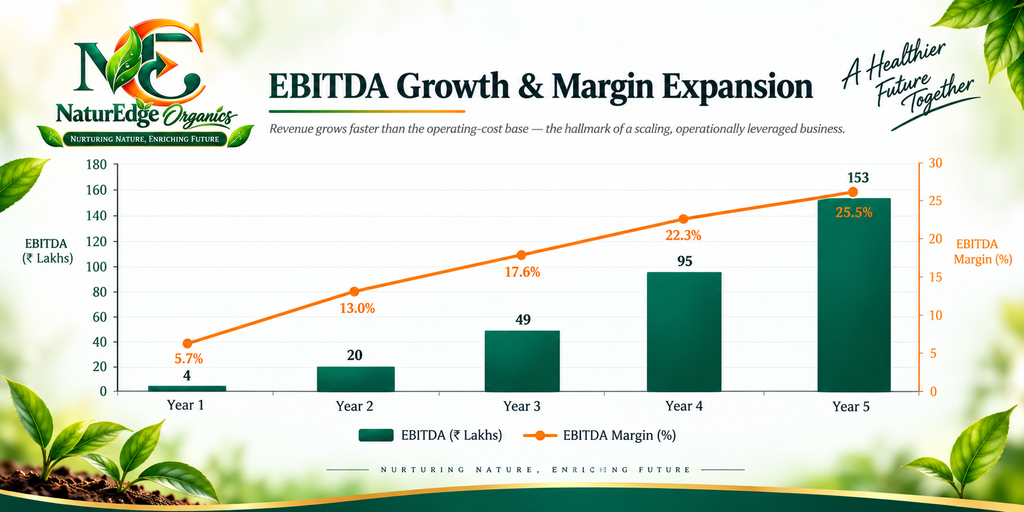
Revenue is projected to grow faster than the operating-cost base, creating operating leverage as the business scales. This results in progressive EBITDA growth and margin expansion over the five-year period.
Projected EBITDA
- Year 1 — ₹4.25 Lakhs
- Year 2 — ₹20 Lakhs
- Year 3 — ₹48.5 Lakhs
- Year 4 — ₹95 Lakhs
- Year 5 — ₹1.53 Crores
EBITDA Margin
- Year 1 — 5.7%
- Year 2 — 13.0%
- Year 3 — 17.6%
- Year 4 — 22.3%
- Year 5 — 25.5%
Risk & Resilience — Year 1 Break-Even Analysis
Year 1 is structured with a built-in revenue cushion above operating break-even. Based on the projected operating expense and gross margin, the business is designed to reach operating break-even within the first year.
Year 1 Break-Even
- Annual Operating Expense — ₹28 Lakhs
- Gross Margin — 43%
- Operating Break-Even Revenue — ₹65.1 Lakhs
- Year 1 Projected Revenue — ₹75 Lakhs
- Revenue Headroom Above Break-Even — ₹10 Lakhs
- Monthly Break-Even — Approximately ₹5.4 Lakhs
This structure means profitability is not positioned as a distant Year 3 or Year 4 milestone; the model is designed to clear operating break-even from Year 1.
Investor KPIs — Five-Year Financial Summary
The following key performance indicators summarize the projected financial trajectory across the five-year period.
| KPI | Year 1 | Year 3 | Year 5 |
|---|---|---|---|
| Revenue | ₹75 Lakhs | ₹2.75 Crores | ₹6.00 Crores |
| Active Distributors | 15 | 50 | 100 |
| Annual Volume | 6 MT | 22 MT | 48 MT |
| Avg. Monthly Revenue | ₹6.25 Lakhs | ₹22.9 Lakhs | ₹50.0 Lakhs |
| Gross Margin | 43% | 46% | 48% |
| EBITDA | ₹4.25 Lakhs | ₹48.5 Lakhs | ₹1.53 Crores |
| EBITDA Margin | 5.7% | 17.6% | 25.5% |
Year 5 Target: The projection targets full-scale performance of approximately 100 active distributors, 48 MT annual volume, ₹6.00 Crores revenue and ₹1.53 Crores EBITDA.
Roadmap — The Five-Year Journey
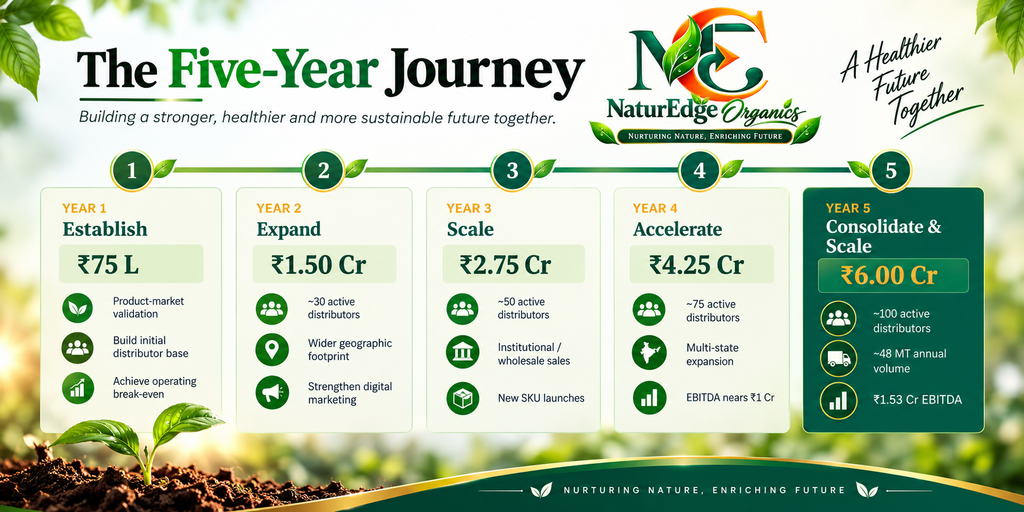
Year 1 — Establish | ₹75 Lakhs
- Product-market validation
- Build initial distributor base
- Achieve operating break-even
Year 2 — Expand | ₹1.50 Crores
- Approximately 30 active distributors
- Wider geographic footprint
- Strengthen digital marketing
Year 3 — Scale | ₹2.75 Crores
- Approximately 50 active distributors
- Institutional / wholesale sales
- New SKU launches
Year 4 — Accelerate | ₹4.25 Crores
- Approximately 75 active distributors
- Multi-state expansion
- EBITDA nears ₹1 Crore
Year 5 — Consolidate & Scale | ₹6.00 Crores
- Approximately 100 active distributors
- Approximately 48 MT annual volume
- ₹1.53 Crores EBITDA
Capital Deployment — Use of ₹25 Lakh Investment
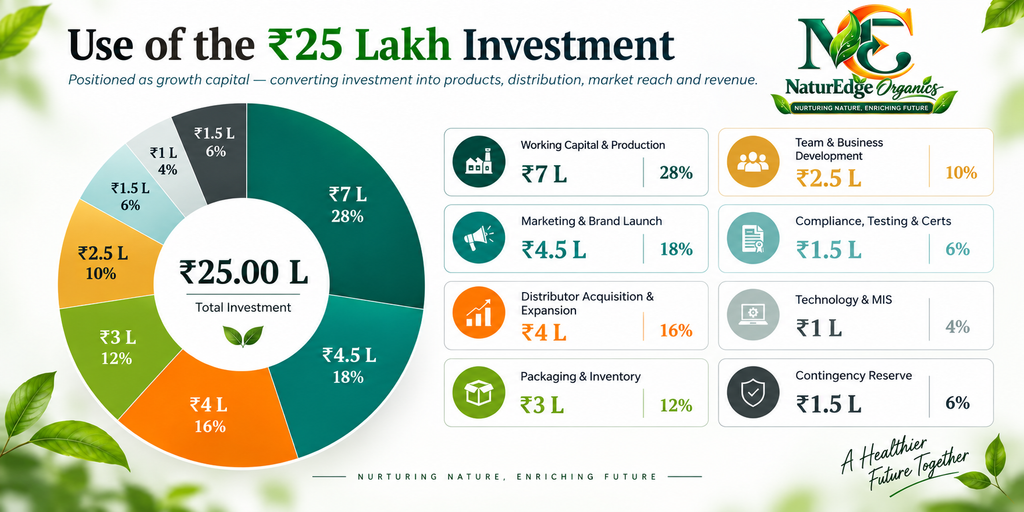
The proposed ₹25 Lakh investment is positioned as growth capital, converting investment into products, distribution, market reach and revenue generation.
Total Investment — ₹25.00 Lakhs
- Working Capital & Production — ₹7.00 Lakhs
- Marketing & Brand Launch — ₹4.50 Lakhs
- Distributor Acquisition & Expansion — ₹4.00 Lakhs
- Packaging & Inventory — ₹3.00 Lakhs
- Team & Business Development — ₹2.50 Lakhs
- Compliance, Testing & Certifications — ₹1.50 Lakhs
- Technology & MIS — ₹1.00 Lakh
- Contingency Reserve — ₹1.50 Lakhs
Investment Discipline — What Makes This Projection Credible
The projection is NOT based on:
- Unrealistic viral growth
- Thousands of retailers from Year 1
- One-time distributor orders
- Artificially low operating costs
- Assuming 100% capacity utilization
- Treating revenue as profit
The projection IS based on:
- Progressive distributor acquisition
- Repeat product purchases
- Portfolio expansion over time
- Increasing geographic coverage
- Improving procurement economics
- Controlled, planned OPEX growth
- Improving gross margins with scale
Investor Economics — Projected Investor Distribution Model
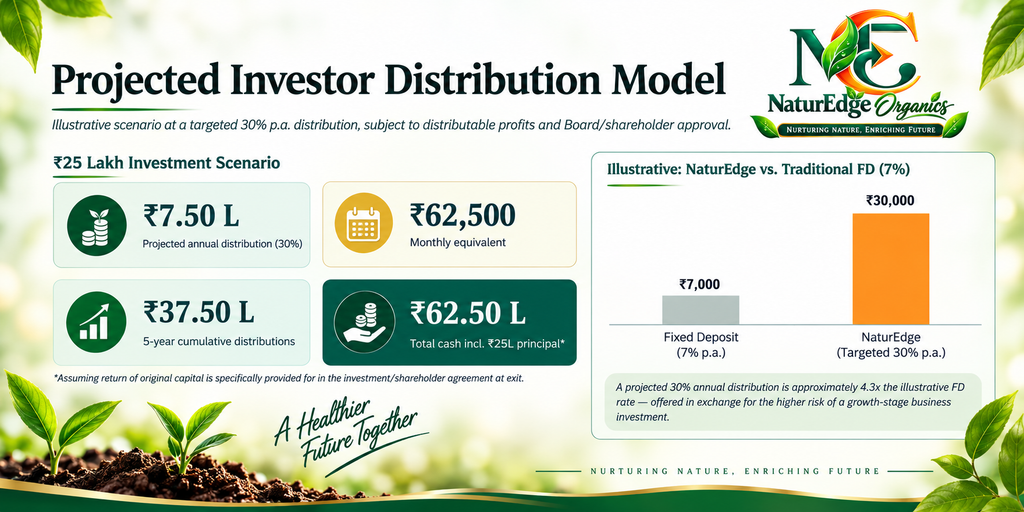
Illustrative scenario at a targeted 30% p.a. distribution, subject to distributable profits and Board/shareholder approval.
₹25 Lakh Investment Scenario
- Investment — ₹25 Lakhs
- Projected Annual Distribution — ₹7.50 Lakhs (30%)
- Monthly Equivalent — ₹62,500
- 5-Year Cumulative Distributions — ₹37.50 Lakhs
- Total Cash Including ₹25 Lakh Principal — ₹62.50 Lakhs*
Assuming return of original capital is specifically provided for in the investment/shareholder agreement at exit.
Illustrative Comparison
A traditional FD at an illustrative 7% rate compared with the targeted 30% annual distribution represents approximately 4.3× the illustrative FD rate, in exchange for the higher risk associated with a growth-stage business investment.
Thank You
Let’s build NaturEdge Organics into a scalable, multi-product organic FMCG business — with a strong distribution network, recurring revenue, and improving operating leverage.
MC Leading Edge Private Limited
Brand: NaturEdge Organics
Kerala, India
Disclaimer: This presentation is intended for discussion with prospective investors only. The financial projections presented are forward-looking estimates, and actual results may differ. Any distributions are subject to distributable profits, applicable law and the final investment/shareholder agreement. The projected returns are not guaranteed.